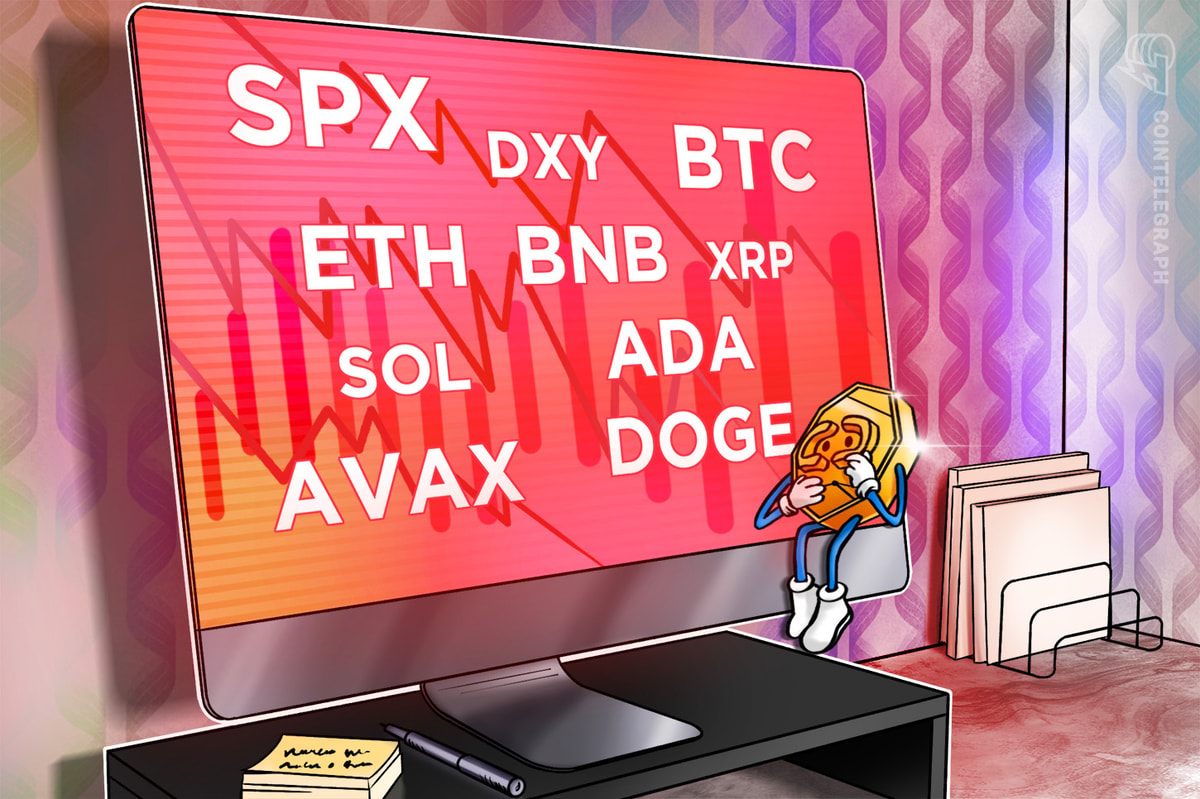
SPX, DXY, BTC, ETH, BNB, XRP, SOL, ADA, AVAX, DOGE


The S&P 500 Index (SPX) rose 2.49% last week, extending its string of weekly gains to seven weeks, the longest such winning streak since 2017. However, Bitcoin (BTC) could not maintain its momentum and succumbed to profit-booking by the bulls. Trading resource Material Indicators said in an X (formerly Twitter) post that “ year-end profit taking and tax loss harvesting” will prevail in the short term.
However, a crash is unlikely because several analysts expect the United States Securities and Exchange Commission to approve one or more spot Bitcoin exchange-traded fund (ETF) applications in January. If that happens, it could prove to be a game-changer for the sector.
VanEck CEO Jan van Eck said in an interview with CNBC that Bitcoin is likely to hit a new all-time high in the next 12 months. He expects Bitcoin to become an accompaniment to gold.
What are the important levels that could arrest the fall in Bitcoin and altcoins? Let’s analyze the charts to find out.
S&P 500 Index price analysis
The S&P 500 Index witnessed a strong bull move in the past few days, which carried the price above the overhead resistance of 4,650 on Dec. 13.

The sharp rally has pushed the relative strength index (RSI) deep into the overbought territory, indicating that the markets are overheated in the short term. That may start a correction or a consolidation over the next few days. The strong support on the downside is at the breakout level of 4,650 and then the 20-day exponential moving average (EMA) (4,601).
If the price continues higher and breaks above 4,740, the index may extend the uptrend to 4,819. This level is again likely to witness a tough battle between the bulls and the bears, but if the buyers prevail, the rally could reach the psychological level of 5,000.
U.S. Dollar Index price analysis
The bulls repeatedly failed to maintain the U.S. Dollar Index (DXY) above the 20-day EMA (103) between Dec. 5 and 13.

That encouraged the bears to renew their selling, driving the index lower. The bears yanked the price below the 61.8% Fibonacci retracement level of 102.55 on Dec. 14, signaling the resumption of the corrective phase. The next strong support is at 101.
The RSI is showing early signs of forming a positive divergence, indicating that the selling pressure could be weakening. If the price rebounds off 101 and rises above the 20-day EMA, the index may continue to swing inside a large range between 101 and 108.
Bitcoin price analysis
Bitcoin’s tight range between the 20-day EMA ($41,323) and the downtrend line resolved to the downside on Dec. 18, but the breakdown lacks momentum.

The flattening 20-day EMA and the RSI near the midpoint suggest a range-bound action in the near term. If the price slips below $40,000, the BTC/USDT pair could collapse to the vital support at $37,980. This level is likely to witness aggressive buying by the bulls.
Alternatively, if the price turns up and climbs back above the 20-day EMA, it will suggest strong demand at lower levels. The bulls will then try to overcome the barrier at the downtrend line. If they do that, the pair may jump to $44,700.
Ether price analysis
Ether (ETH) slipped below the strong support at $2,200 on Dec. 18, indicating that the bulls may be losing their grip.

If the price maintains below $2,200, the ETH/USDT pair could slump to the 50-day SMA ($2,074). This level may again attract buyers, but the bears will try to halt the recovery at $2,200. If that happens, the possibility of a break below the 50-day SMA increases. The pair may then plunge to $1,900.
This negative view will be invalidated in the near term if the price rises above $2,200. That will suggest strong buying at lower levels. The pair will then try to surge to the overhead resistance at $2,332.
BNB price analysis
The failure of the bulls to push BNB (BNB) above $260 may have tempted short-term traders to book profits.

That started a pullback, which dipped below the moving averages on Dec. 18. The 20-day EMA ($240) has started to turn down, and the RSI has slipped below the midpoint, indicating that the bears are trying to gain the upper hand. This increases the likelihood of a fall to $223.
If the price rebounds off the $223 support with force and rises above the moving averages, it will indicate strong buying at lower levels. The BNB/USDT pair could then oscillate between $223 and $260 for a few more days.
XRP price analysis
The failure of the bulls to push XRP (XRP) back above the moving averages in the past few days attracted another round of selling.

The bears will try to sink the price to the strong support at $0.56. If the price rebounds off this level and rises above the 20-day EMA ($0.62), it will suggest that the XRP/USDT pair may remain stuck between $0.73 and $0.56 for a while longer.
The first sign of weakness will be a break and close below the strong support at $0.56. That could clear the path for a drop to the crucial support at $0.46. The next leg of the uptrend is likely to begin after buyers drive the price above $0.74.
Solana price analysis
Solana’s SOL (SOL) turned down from $79.50 on Dec. 15 and reached the 20-day EMA ($67.77) on Dec. 18.

The bulls have not allowed the SOL/USDT pair to close below the 20-day EMA since the start of the rally on Oct. 16. Hence, a break of the level is likely to trigger the stops of several traders. That could start a decline to the 50-day SMA ($57.83) and thereafter to the psychological support at $50.
If bulls want to prevent the deeper pullback, they will have to aggressively defend the 20-day EMA and propel the price above $80. That will set the stage for a potential rally to $100.
Related: Spot Bitcoin ETF will be ‘bloodbath’ for crypto exchanges, analyst says
Cardano price analysis
Cardano’s ADA (ADA) rose above the $0.65 overhead resistance on Dec. 13, but the bulls could not sustain the momentum. The price turned down on Dec. 14 and dipped back below $0.65.

The sharp pullback from $0.68 indicates that the bulls are booking profits in a hurry. That suggests the ADA/USDT pair could consolidate its recent gains in the next few days. If the price rebounds off the 20-day EMA ($0.53), the pair may rise toward $0.68 and remain stuck between these two levels for some time.
A break below the 20-day EMA could accelerate selling, opening the doors for a further fall to the strong support at $0.46.
Avalanche price analysis
Buyers pushed Avalanche’s AVAX (AVAX) above the overhead resistance of $42.50 on Dec. 16 and 17, but they could not sustain the higher levels.

The AVAX/USDT pair has started a pullback, which has strong support at the 20-day EMA ($33). If the price rebounds off this level with strength, it will suggest that the sentiment remains positive and the bulls are buying on dips. On the upside, a break and close above $45 will signal the resumption of the uptrend. The next target is at $50.
On the contrary, if the price skids below the 20-day EMA, it will signal that the bulls are rushing to the exit. That may lead to a deeper correction to $25.
Dogecoin price analysis
Dogecoin (DOGE) rebounded off the 20-day EMA ($0.09) on Dec. 16, but the bulls could not maintain the higher levels.

The price turned down on Dec. 17 and plunged below the 20-day EMA on Dec. 18. The 20-day EMA is flattening out, and the RSI is near the midpoint, indicating a balance between supply and demand.
If the price maintains below the 20-day EMA, the advantage will tilt in favor of the bears. The DOGE/USDT pair could plummet to the 50-day SMA ($0.08).
If bulls want to salvage the situation, they will have to quickly push the price back above the 20-day EMA. The bullish momentum could pick up after buyers clear the hurdle at $0.11.
This article does not contain investment advice or recommendations. Every investment and trading move involves risk, and readers should conduct their own research when making a decision.


