BTC/USD Corrects Gains As Price Drops to $53,379


Bitcoin Price Prediction – October 7
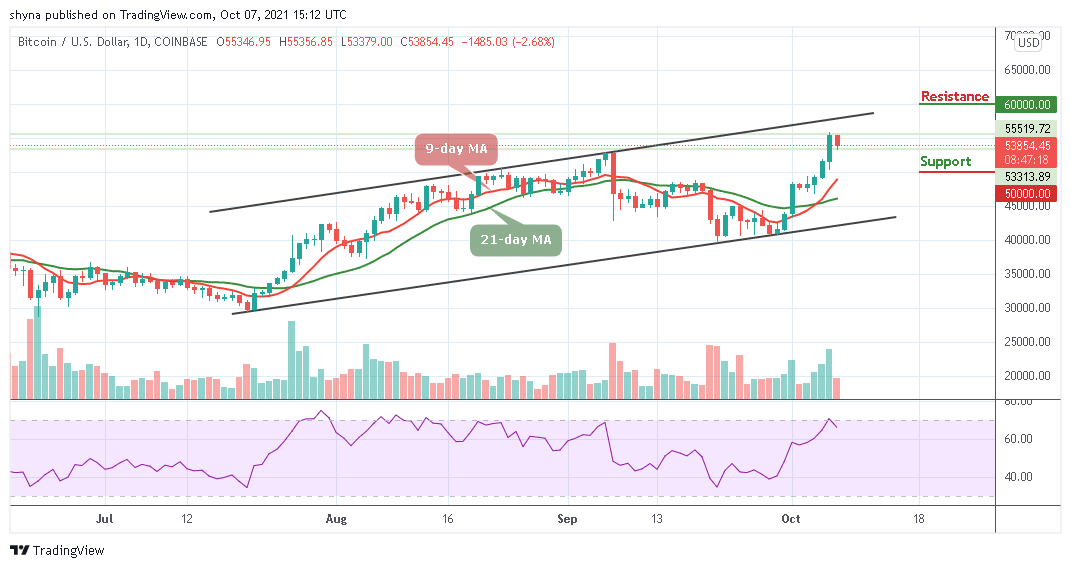
After the opening of the market today at $55,346, the Bitcoin price begins a downside correction as the price touches the low of $53,379 support.
BTC/USD Long-term Trend: Bullish (Daily Chart)
Key levels:
Resistance Levels: $60,000, $62,000, $64,000
Support Levels: $50,000, $48,000, $46,000
At the time of writing, BTC/USD is seen slipping below the $54,000 level as buying pressure cooled off. The Bitcoin price is now hovering around $53,854.45 to form a low near the support level of $53,000 before stabilizing. At the time of writing, BTC/USD continues to trade above the 9-day and 21-day moving averages but it is down by 2.68%.
Bitcoin Price Prediction: Bitcoin (BTC) May Target Additional Gains
The Bitcoin price is presently correcting lower since the beginning of the day. A decisive break down below the support level of $53,000 may intensify selling pressure. Therefore, if bears push the market price downwards, the consolidation may turn into a bear-run. Moreover, the sideways movement is likely to play out for the next few days and the next hurdle for the king coin could surface at $56,000, but it won’t stop the higher price movements.
However, bulls need massive liquidity and volume to cross the $57,000 highs and make a dash to the $58,000 level. The technical indicator Relative Strength Index (14) is seen moving below the 70-level from the overbought zone as the sharp downward slope is a clear indication of the influence which may allow bears to increase the pressure.

Meanwhile, a reversal is possible but only if the resistance at $55,000 is reclaimed. The persistence trade above this level may technically push the coin to the resistance levels of $60,000, $62,000, and $64,000 while the supports lie at $50,000, $48,000, and $46,000.
BTC/USD Medium – Term Trend: Bullish (4H Chart)
Looking at the 4-Hour chart, Bitcoin (BTC) has not yet slipped below $53,000 but in the loop of making a bounce back. The Bitcoin price hovers around the 9-day moving average and may likely take time to trade above the $55,000. At the moment, the Bitcoin price is currently moving around $54,051 level.
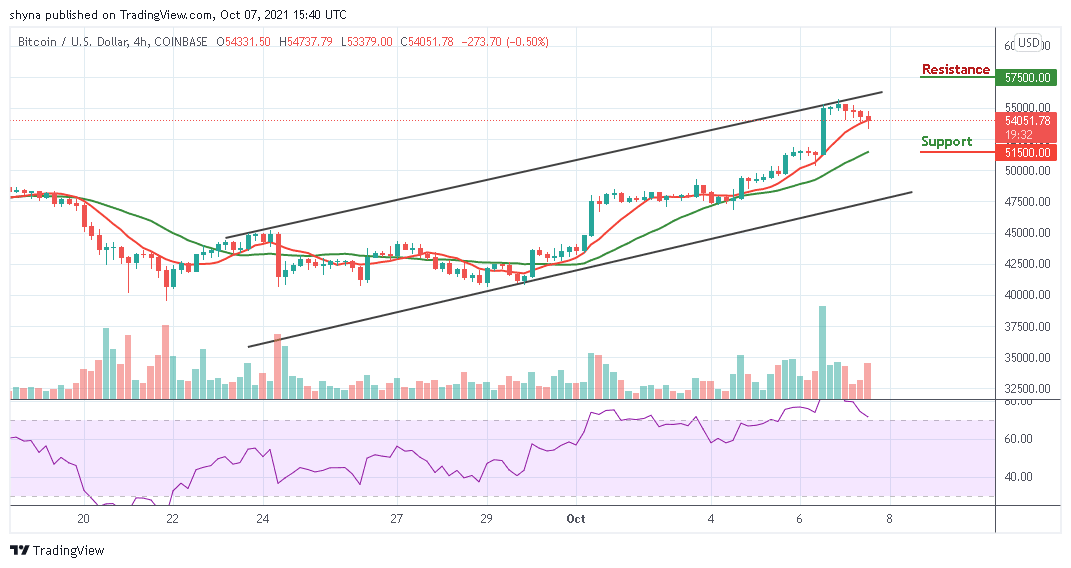
However, if the bulls energize the market, the price may likely touch the resistance levels of $57,500 and above. In other words, if the bears should continue to hold the price and drag it downward, then the support level of $51,500 and below may be visited as the Relative Strength Index (14) may move out of the overbought zone, indicating additional bearish movement.
Looking to buy or trade Bitcoin (BTC) now? Invest at eToro!
67% of retail investor accounts lose money when trading CFDs with this provider
Read more:


