Bitcoin Price Prediction: BTC/USD Retraces Below $66,000


Bitcoin Price Prediction – October 21
The Bitcoin price indicates bearish momentum as further upside got rejected and bullish momentum has been lost.
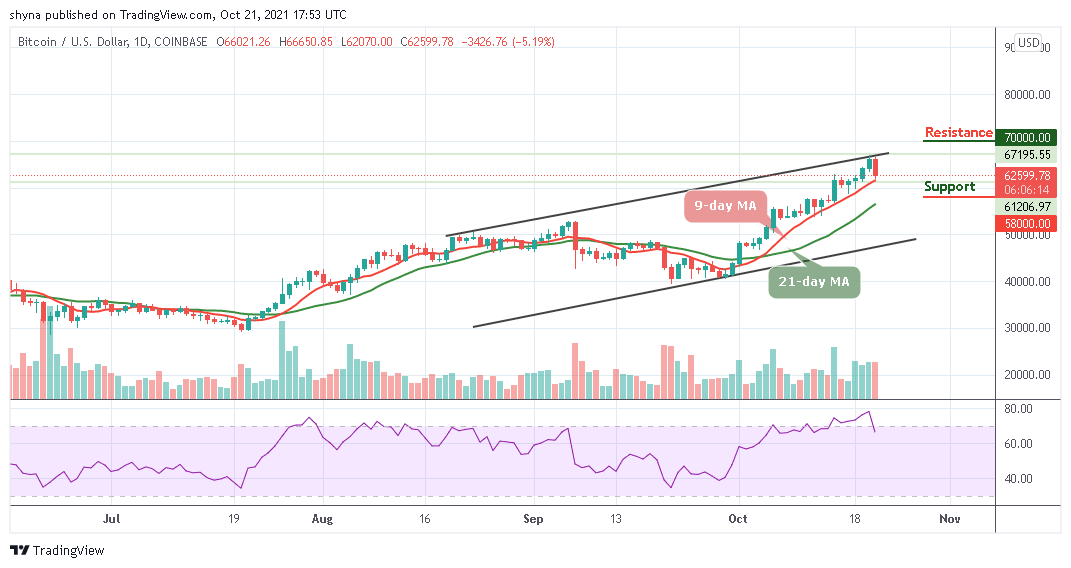
BTC/USD Long-term Trend: Bullish (Daily Chart)
Key levels:
Resistance Levels: $70,000, $72,000, $74,000
Support Levels: $58,000, $56,000, $54,000
At the time of writing, BTC/USD is hovering at $62,599. There have been instances when BTC has exchanged hands below $63,000 sustaining the bearish price action is a downhill task. At the time of writing, the path of least resistance is still downwards and the daily chart shows that the formation of a bearish may come to play.
Bitcoin Price Prediction: BTC Fails at Crucial Resistance
Looking at the technical indicator Relative Strength Index (14) is leaving the overbought region; with the look of things, the Bitcoin price is not yet done with the upside but despite the drop suffered today, the technical indicator Relative Strength Index (14) is still hovering within the overbought region. This could mean that there may still be a room that could be explored by the bulls as the Bitcoin price may continue to follow the uptrend in as much as the king coin remains above the 9-day and 21-day moving averages.
On the upside, recovery may not come easy as the support will have to be sort for above the upper boundary of the channel. Meanwhile, a sustainable move above the upper boundary of the channel could locate the resistance level of $65,500, which may allow for an extended recovery towards the $70,000, $72,000, and $74,000. However, an increase in selling pressure across the market could force the Bitcoin price towards a painful path and through various tentative supports at $58,000, $56,000, and $54,000.

BTC/USD Medium-Term Trend: Bullish (4H Chart)
When checked on the 4-hour chart, the Bitcoin price is now trading below the 9-day and 21-day moving averages. BTC/USD has just survived the $62,442 support as the market is trying to recover from the bearish momentum. However, BTC/USD is likely to return to the bull market if the price breaks above the 21-day moving average. Meanwhile, higher resistance could be located at the $64,000.
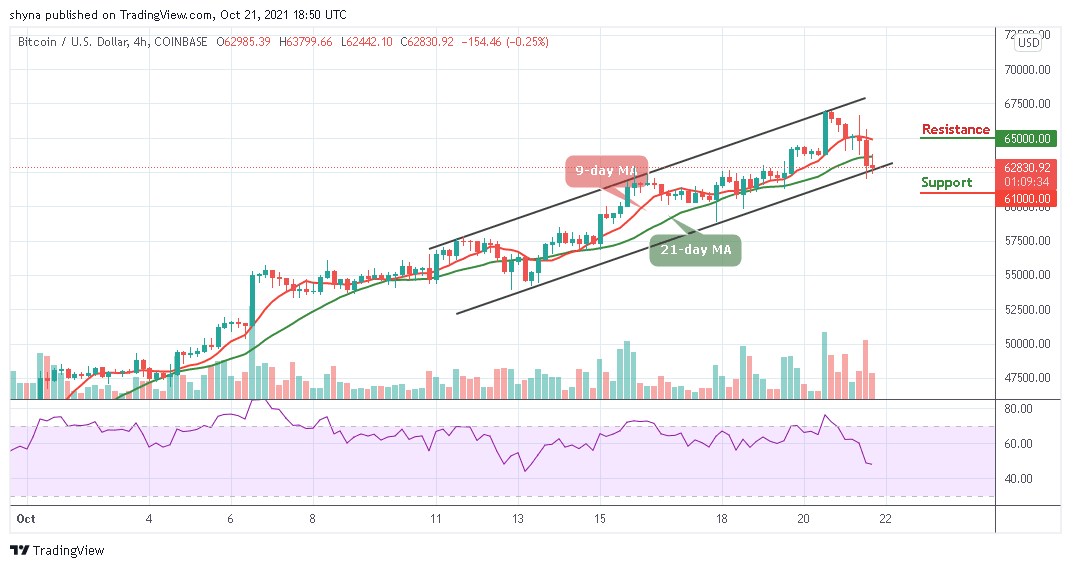
On the other hand, as the technical indicator Relative Strength Index (14) moves to cross below 45-level, if the bearish movement steps back, the support level of $62,000 may not be able to hold the selling pressure. More so, BTC/USD is likely to fall to $61,000 and below if the price crosses below the lower boundary of the channel.
Looking to buy or trade Bitcoin (BTC) now? Invest at eToro!
67% of retail investor accounts lose money when trading CFDs with this provider
Read more: