Bitcoin Price Prediction: BTC/USD Reaches $60,000 Level


Bitcoin Price Prediction – October 14
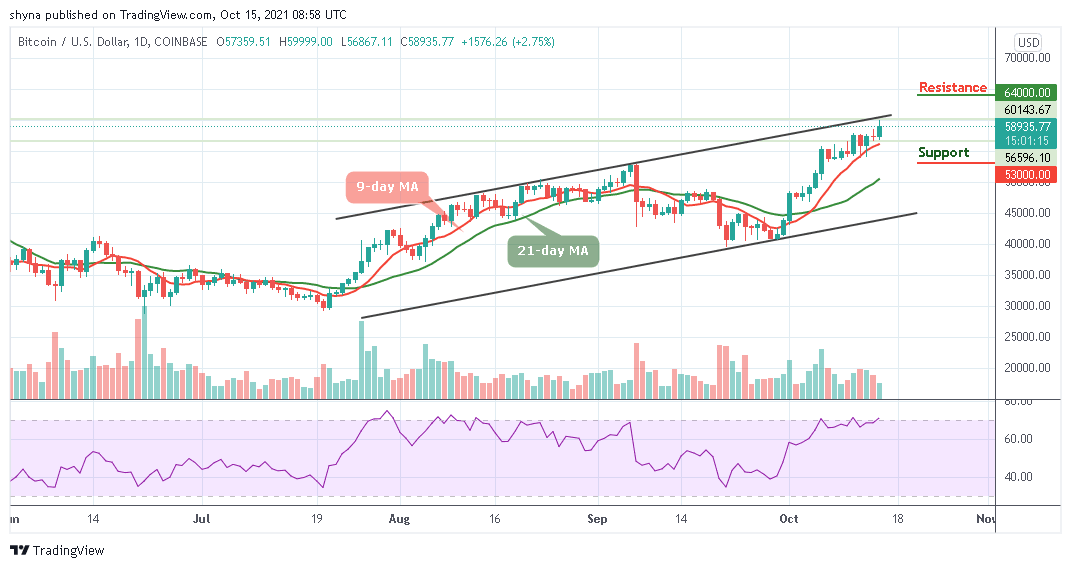
The Bitcoin price touches the daily high of $59,999, the coin is holding above $59,000 level and it may likely retest $58,000 before rising again.
BTC/USD Long-term Trend: Bullish (Daily Chart)
Key levels:
Resistance Levels: $64,000, $66,000, $68,000
Support Levels: $53,000, $51, 000, $49,000
BTC/USD has been extremely volatile as the coin touches the daily high of $59,999 and after touching the daily low of $56,867. At the moment, BTC/USD is in an ascending channel forming higher highs and higher lows. Therefore, since the price is above the 9-day and 21-day moving averages, it indicates that a break above the channel may likely come to play.
Bitcoin Price Prediction: Bitcoin (BTC) May Trade Above $60,000
According to the daily chart, if the Bitcoin price keeps hovering near the upper boundary of the channel, traders can expect a cross above the upper boundary of the channel. However, it is important to note that the red-line of 9-day MA is still above the green-line of the 21-day MA which confirms the presence of the bullish trend.
In the meantime, if the Bitcoin price drives below the 9-day moving average, it could see support levels at $53,000, $51,000, and $49,000, bringing the price to a new low. Meanwhile, a strong buying pressure may take the price to the resistance level of $60,000. While trading at that level, a bullish continuation could hit the potential resistance levels of $64,000, $66,000, and $68,000 as the Relative Strength Index (14) is likely to cross into the overbought region.

BTC/USD Medium – Term Trend: Bullish (4H Chart)
Looking at the 4-hour chart, BTC/USD remains trading above the 9-day and 21-day moving averages. Nevertheless, Bitcoin has not yet slipped below this barrier as it is still in the loop of making a bounce back. Therefore, BTC price hovers around $59,337 and may take time to trade above the upper boundary of the channel. The upward movement could face the resistance levels of $62,000 and above.

However, on the downside, immediate support is below the moving averages while the main support is at the $58000 level. The price might slide sharply below $57,500 which may likely test the main support at $57,000 level. More so, BTC/USD is likely to face more losses in the near-term as the Relative Strength Index (14) nosedives below 65-level, indicating a reversal for the bearish movement.
Looking to buy or trade Bitcoin (BTC) now? Invest at eToro!
67% of retail investor accounts lose money when trading CFDs with this provider
Read more:


